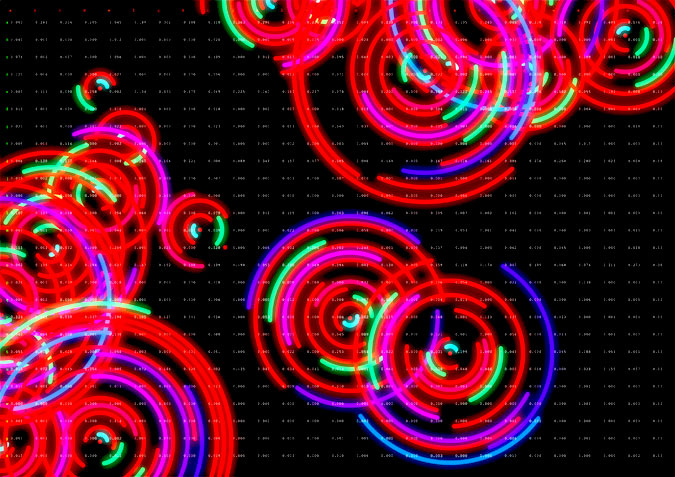
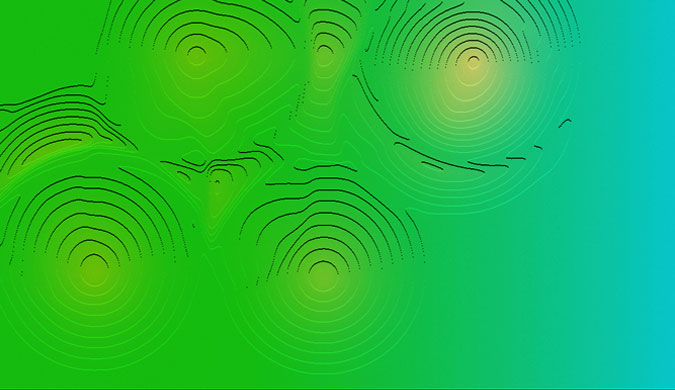
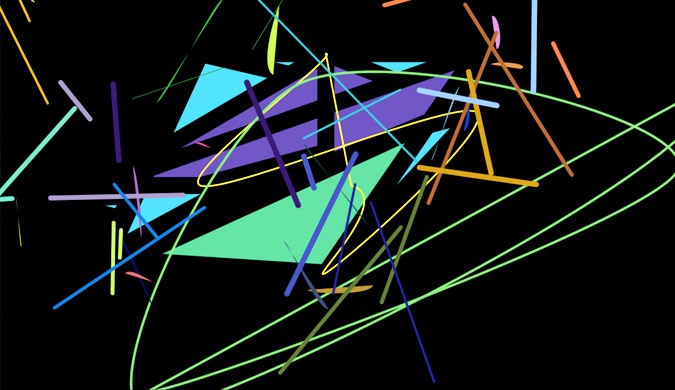
MarkovPaint is a little experiment that wishes to interpret results coming out of mathematical processes and translate them into visual graphics, shifting our approach and interpretation of the numbers.
It started out as an investigation on Markov Chains to generate custom graphics.
The user can type a phrase which will be translated into a visual representation, with various graphical functions.
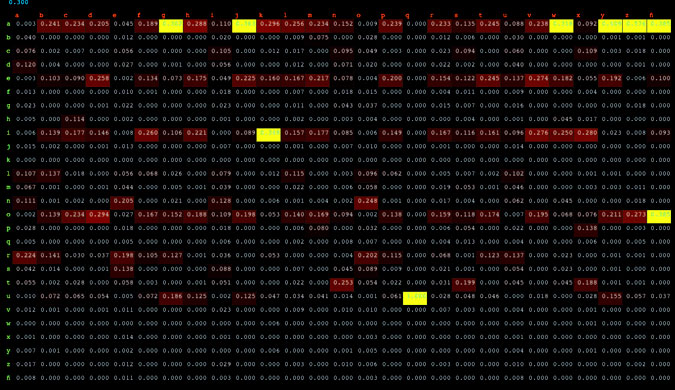
An analisys of the Spanish Royal Academy Dictionary is run to determine the probabilities of a letter ocurring after another, which than aids in carrying out matrix multiplications on the user input.
The amount of outputs can be infinite, because the amount of graphical function that may interpret the values from the matrices can be infinite too. This simply depends on the creativity of the coder.
Check out the full PDF of the Proyect.
It has a lot more visual representations and an inDepth Process Analisys:
-- Download MarkovPaint PDF
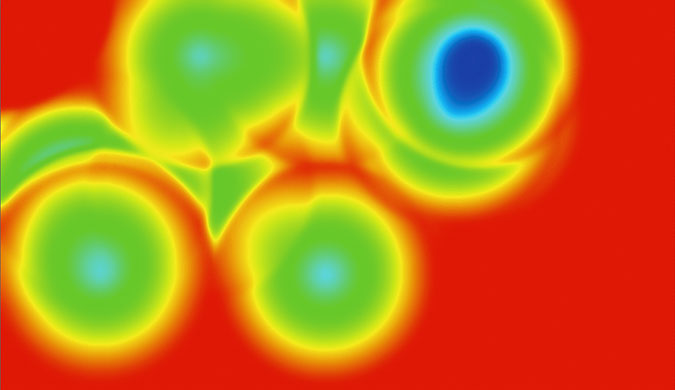
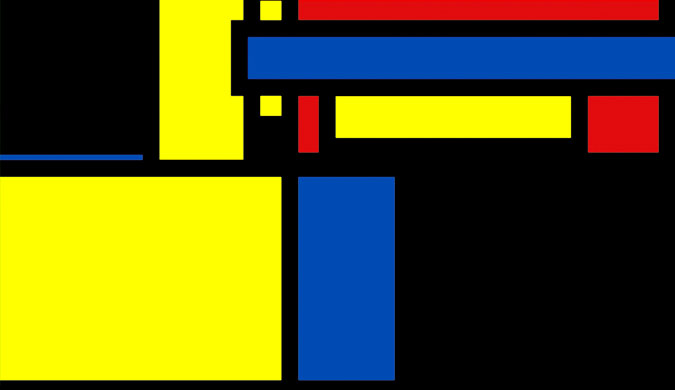
Following are some samples of the coded graphics: |
